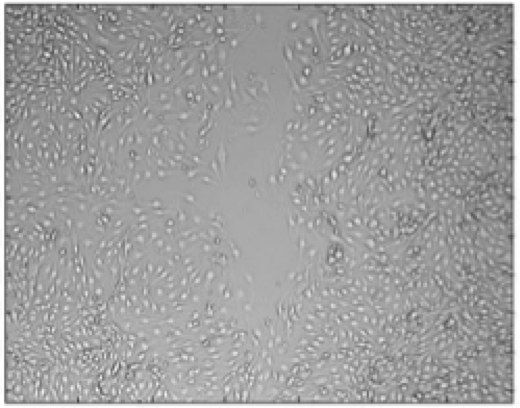
The wound-healing assay is considered the gold standard for studying cell motility and migration. The assay is performed by time-lapse imaging (usually by phase contrast, or differential interference contrast (DIC) microscopy) of the closure of a wound formed by scratching a confluent cell culture. The rate of change in the wound's area is recorded and can be compared with other cells and treatments. Marking the region of interest for each image is the basic task required. The high variability in imaging conditions and cellular appearance requires robust algorithms that can deal with this diversity automatically and accurately—and preferably without the need for parameter tuning. The general problem of segmenting cell clusters in bright-field images is also important for other applications, such as quantifying scatter, thus emphasizing the importance of segmenting images of non-confluent cells.
Images
171 images were partitioned to the eight data sets detailed below.
TScratch
24 images available at the TScratch (software for wound healing segmentation) website (without details of the source), were acquired using a Zeiss Axiovert 200 M microscope equipped with a Zeiss AxioCam MRm camera with maximum contrast (Carl Zeiss AG, Feldbach, Switzerland).
20 images of cell populations of brain metastatic melanoma during a would healing experiment were acquired in the I. Witz lab using an inverted microscope (Eclipse TE 2000-S; Nikon, Enfield Enfield, CT, USA) fitted with a digital camera (DXM1200F; Nikon).
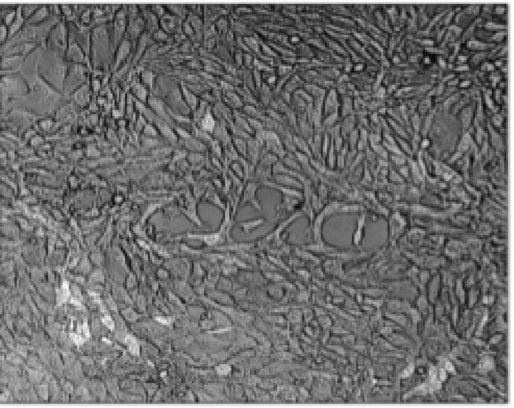
28 DIC images (pixel size 0.625×0.625 µm) of confluent DA3 cells were acquired using LSM-410 microscope (Zeiss, Germany) in non-confocal mode from 2 single-well experiments in Ilan Tsarfay's laboratory at Tel Aviv University.
54 DIC images (pixel size 1.24×1.24 µm) of confluent DA3 cells were acquired using LSM-510 microscope (Zeiss, Germany) in non-confocal mode, from 27 different wells in a wound healing multi-well experiment performed in Ilan Tsarfay's laboratory at Tel Aviv University.
6 DIC images of MDCK cells were acquired using LSM-410 microscope (Zeiss, Germany) in non-confocal mode from a 96-well plate scatter experiment performed in Ilan Tsarfay's laboratory at Tel Aviv University.
13 DIC images (pixel size 0.5 x 0.5 µm) of MDCK cells grown in a Cellasic Onix M04S microfluidic plate, acquired using Leica STED microscope in non-confocal mode from a scatter assay with HGF/SF gradient experiment performed in Ilan Tsarfay's laboratory at Tel Aviv University.
12 DIC images (pixel size 2.5 x 2.5 µm) of confluent HEK293T cells were acquired using LSM-410 microscope (Zeiss, Germany) in non-confocal mode from a multi-well wound healing experiment in Ilan Tsarfay's laboratory at Tel Aviv University.
14 DIC images (pixel size either 0.88 x 0.88 or 1.24 x 1.24 µm) of confluent MDCK/YFP-membrane cells in a wound healing 24-well plate experiment performed in Ilan Tsarfay's laboratory at Tel Aviv University. Images were acquired with an LSM-510 microscope (Zeiss, Germany) in non-confocal mode.
To collect ground truth, each image was manually segmented to enable comparisons between accuracies of different segmentations. There ground truth is stored as one binary bitmap image in PNG format per input image, named identically except for the ".png" at the end of the filename. White (1) denotes foreground.
Published results using this image set
The accuracy reported in the chart below is defined as follows:
Zaritsky, et al.: Benchmark for multi-cellular segmentation of bright field microscopy images. BMC Bioinformatics 2013 14:319. [link]
Acknowledgements
Melanoma images were acquired by Sivan Izraeli from Isaac P. Witz's laboratory. TScratch images were taken from the TScratch website. The rest of the images were acquired by Sari Natan, Doron Kaplan, and Yaniv Goikhman from Ilan Tsarfay's laboratory at Tel Aviv University. Doron Kaplan labeled regions of interest in "MDCK" images. Assaf Zaritsky labeled the regions of interest in all other images and ran the algorithms.
Version history
2013-10-28 Version 2: Added four new datasets: Scatter, Microfluidics, HEK293, and MDCK


 The BBBC019v2 image set are licensed under a Creative Commons Attribution 3.0 Unported License by Petros Komoutsakos (TScratch), Isaac P. Witz, Ilan Tsarfay, and Assaf Zaritsky.