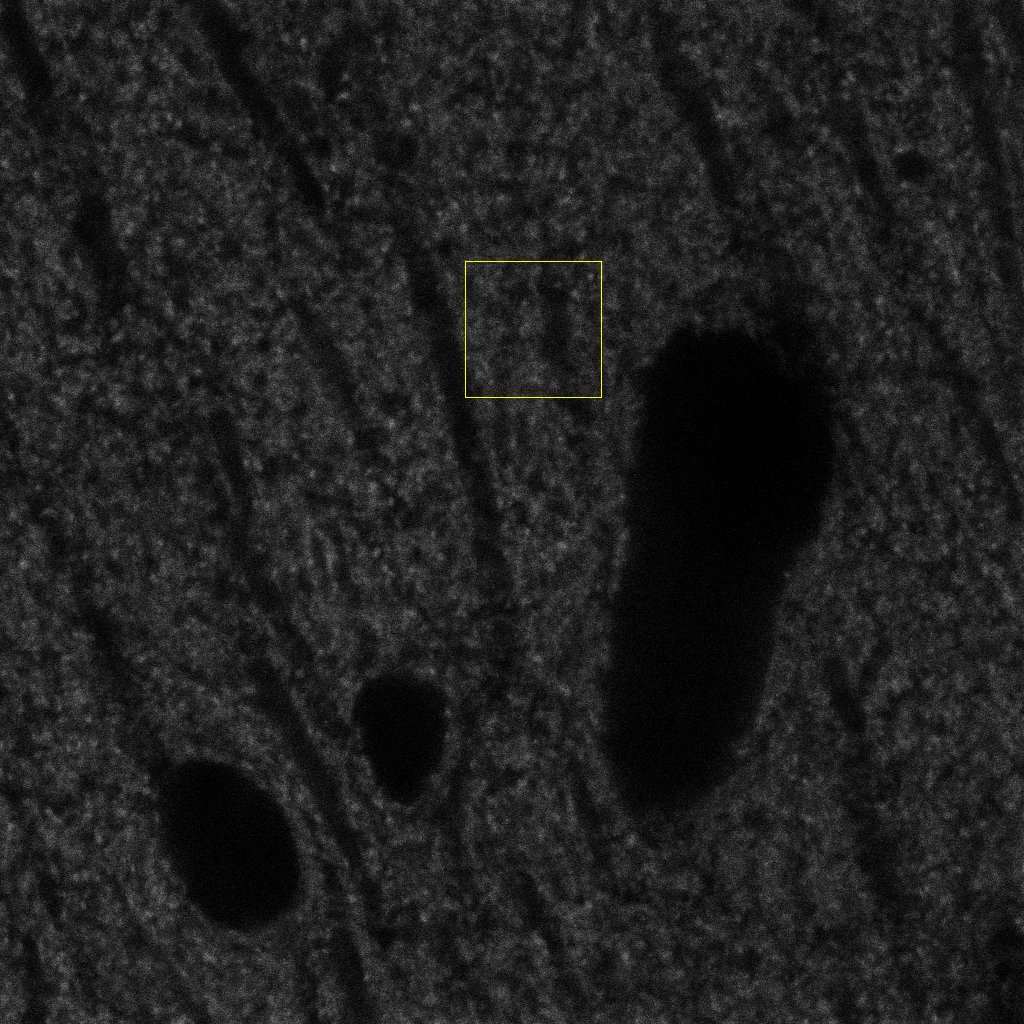
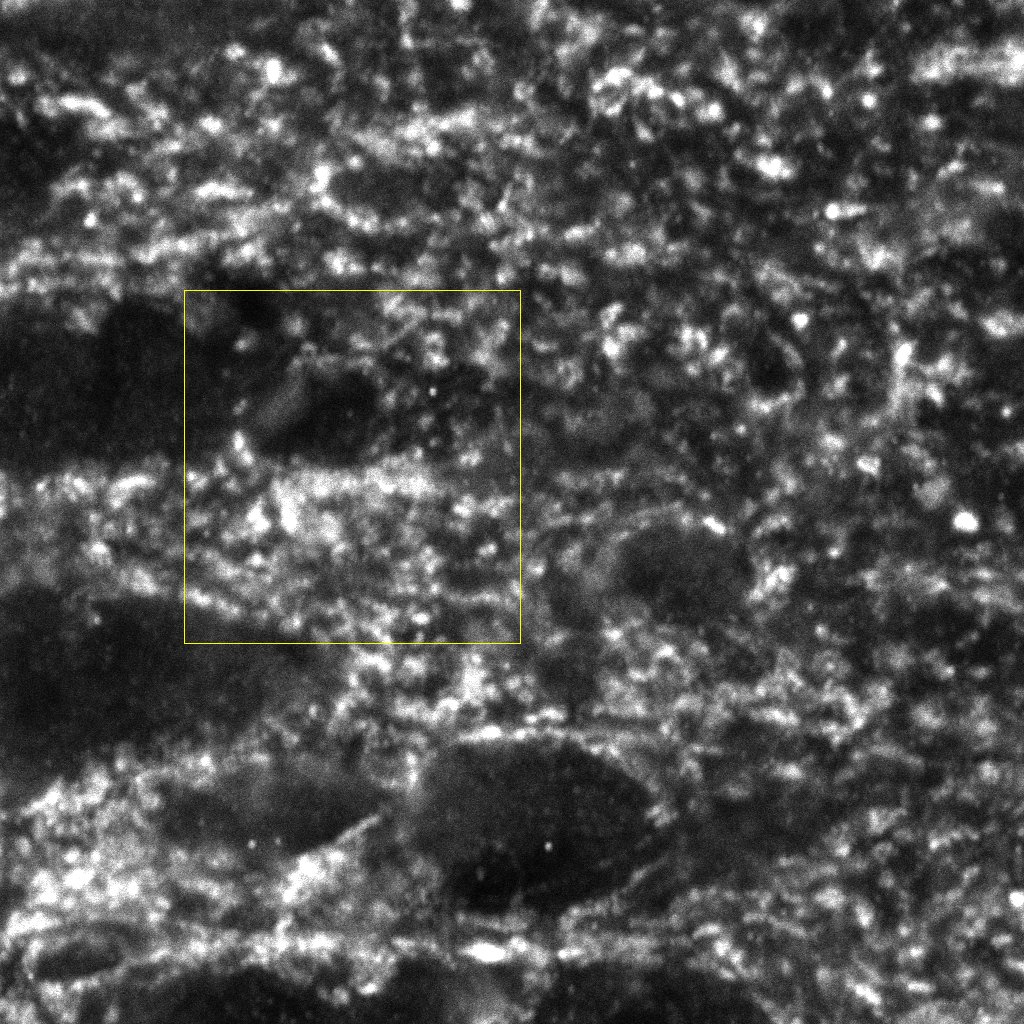
These images are of mouse hippocampal presynaptic terminals and the goal is to extract presynaptic terminals' densities.
The presented seet of images were being used to validate the accuracy of automatic detection and counting methods
Images
Sections were directly analyzed with a Zeiss LSM 710 Confocal microscope. Fluorescently labeled profiles were examined through separate channels, using excitation peaks of 401, 488, 594 and 634 nm to visualize DAPI, vGlut-1 EGFP, NeuN and vGat, respectively. Consecutive stacks of images, at high magnification (63×; oil immersion), using tile scan mode, were acquired in the hippocampal region. Each stack was composed by 15 images (0.14 μm z-step) of 1024 × 1024 pixels (8 bit). Confocal parameters were set so that the fluorescence signal was as bright as possible while ensuring that there were no saturated pixels.
12 stacks (1024x1024x15) were selected for validation (6 vGlut-1 and 6 vGat). Original images are 8-bit TIFF files.
12 stacks of 15 images (6 vGlut-1 and 6 vGat) were partially labeled by two experts. The experts were asked to mark with a point every puncta centroids they saw in a bounded rectangular region of the stack.
The ground truth is provided both as an ImageJ overlay over the original image and as two additional color channels, one marking the centroids the other showing the region involved in the validation. Files are provided as RGB images, where R = original image, G = expert's centroids, B = region of the validation.
The coordinates of the expert's centroids are also provided as csv files.
Moreover the counts of the two experts are provided in a single csv file.
The entire stack can be used by the algorithm to detect the objects but the validation is performed just on the given region.
To validate an object detection algorithm compute precision and recall for each of the two experts. For that consider an object as correctly detected if a point given by the expert lies inside one of the objects detected by the algorithm, obviously without associating in this way more than one point with the same object. Then, compute precision as the fraction of correctly detected objects over the total number of objects detected by the algorithm. Recall is the fraction of correctly detected objects over the total number of objects identified by the expert.
The F1 score, that is, the harmonic mean of precision and recall, is used as a summarizing measure.
To validate a counting algorithm just compare for every stack the number of objects estimated in the validation regions with the mean count of the two experts and compute the average relative error between the two values. The average relative errors for the two experts is 0.29 (0.2 for the vGlut-1 marker and 0.38 for the vGat marker).
Varando G, et al. MultiMap: A Tool to Automatically Extract and Analyse Spatial Microscopic Data From Large Stacks of Confocal Microscopy Images. Front. Neuroanat. 2018;12:37. doi:10.3389/fnana.2018.00037. PMCID: PMC5974206


 The images and ground truth are licensed under a Creative Commons Attribution-NonCommercial-ShareAlike 3.0 Unported License by Gherardo Varando, Ruth Benavides-Piccione , Alberto Muñoz, Asta Kastanauskaite.