Human MCF7 and A549 cells cytoplasm–nucleus translocation

Accession number BBBC014 · Version 1

Example images

Positive Negative
Positive Negative

Biological application

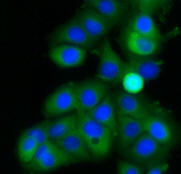
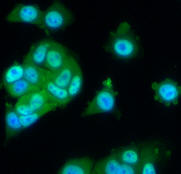
This 96-well plate has images of cytoplasm to nucleus translocation of the transcription factor NFκB in MCF7 (human breast adenocarcinoma cell line) and A549 (human alveolar basal epithelial) cells in response to TNFα concentration.

Images

Images are at 10x objective magnification. The plate was acquired at Vitra Bioscience on the CellCard reader. For each well there is one field with two images: a nuclear counterstain (DAPI) image and a signal stain (FITC) image. Image size is 1360 x 1024 pixels. Images are in 8-bit BMP format.

 BBBC014_v1_images.zip (121 MB)

Ground truth  Biological labels button B

File name structure is ----.BMP

The plate map is a standard 96-well plate, containing 12 concentration points in columns and 4 replica rows for each cell type.

 BBBC014_v1_platemap.xls (22 kB)

The following files encodes this plate map in the format expected by CellProfiler's LoadText module:

All samples

BBBC014_v1_platemap_all.txt (800 b)

Single cell type (rows A–D or E–H)

BBBC014_v1_platemap_half.txt (408 b)

Published results using this image set

None.

For more information

These images were originally gathered for Ilya Ravkin's Invitation to Participate in the Comparison of Image Analysis Algorithms for Intracellular Screening.

Recommended citation

"We used image set BBBC014v1 provided by Ilya Ravkin, available from the Broad Bioimage Benchmark Collection [Ljosa et al., Nature Methods, 2012]."

Copyright

Creative Commons LicenseThe SBS Bioimage CNT images are licensed under a Creative Commons Attribution 3.0 Unported License by Ilya Ravkin.