Human U2OS cells transfluor

Accession number BBBC016 · Version 1

Example images

Positive Negative
Positive Negative

Description of the biological application

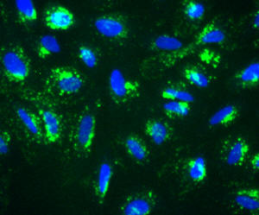
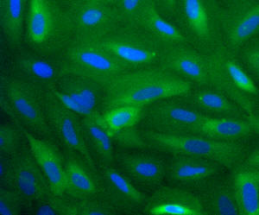
This image set is of a Transfluor assay where an orphan GPCR is stably integrated into the b-arrestin GFP expressing U2OS cell line. After one hour incubation with a compound the cells were fixed with (formaldehyde).

Images

The plate was read on Cellomics ArrayScan HCS Reader using the GPCR Bioapplication. File format is 8-bit TIFF with one image for green channel (GFP) and one image for blue channel (DNA). Image size is 512 x 512 pixels.

BBBC016_v1_images.zip (26 MB)

Ground truth  Biological labels button B

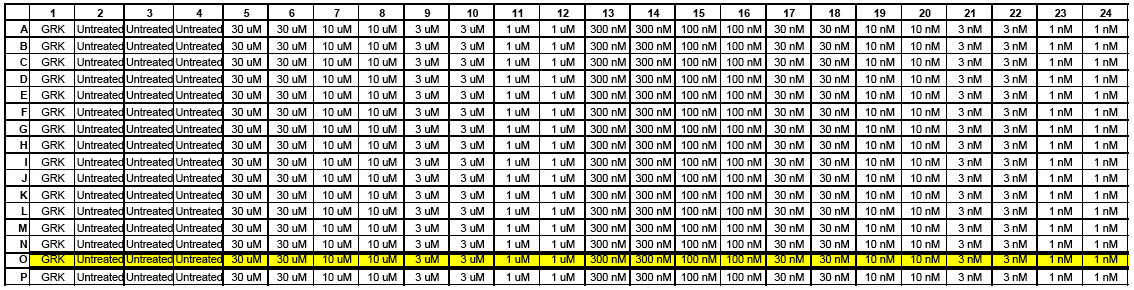
The images constitute one row of a 384 well plate. The dose curve consists of 11 dose points and one control. Each concentration is duplicated in adjacent wells. Each well has three fields. File name structure: _.TIF

Plate map

BBBC016_v1_platemap.xls (22 kB)

The following file encodes this plate map in the format expected by CellProfiler's LoadText module:

BBBC016_v1_platemap.txt (324 b)

Published results using this image set

 
Z'-factor V-factor Citation
0.43*   Carpenter et al., Genome Biol., 2006
  0.67 Logan and Carpenter, J. Biomol. Screening, 2010

* Integrated intensity on edge of speckles in green channel
† Radial distribution CV of intensity

Files to reproduce results in Logan and Carpenter, J. Biomol. Screening, 2010 (includes CellProfiler pipelines and metadata):

BBBC016_reproduce_logan.zip (5.4 MB)

For more information

These images were originally gathered for Ilya Ravkin's Invitation to Participate in the Comparison of Image Analysis Algorithms for Intracellular Screening.

Recommended citation

"We used image set BBBC016v1 provided by Ilya Ravkin, available from the Broad Bioimage Benchmark Collection [Ljosa et al., Nature Methods, 2012]."

Copyright

Creative Commons LicenseThe BBBC016 images are licensed under a Creative Commons Attribution 3.0 Unported License by Ilya Ravkin.