
Accession number BBBC017 · Version 1
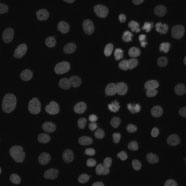
Example image
Biological application
These images are of human HT29 colon cancer cells, a cell line that has been widely used for the study of many normal and neoplastic processes. Moffat et al. (Cell, 2006) used the HT29 cell line to screen 4,903 shRNAi constructs (targeting 1,028 human genes) in order to find mitotic regulators.
Experiment
The experiment consists of 10,752 samples, laid out on 28 384-well plates. The samples were stained with Hoechst 33342, pH3, and phalloidin. Hoechst 33342 is a DNA stain that labels the nucleus. Phospho-histone H3 indicates mitosis. Phalloidin labels actin, which is present in the cytoplasm.
Puromycin In addition to delivering the hairpin, the lentivirus makes the cells resistant to the antibiotic puromycin. Thus, one can measure the fraction of cells infected by infecting two wells with lentiviruses for the same hairpin, treat only one of the wells with puromycin, and count the number of surviving cells in each of the two wells. The infection is considered successful if at least 25 percent of the cells are resistant to puromycin. The screen was done in duplicate, and one replicate (14 plates) was treated with puromycin.
Images
Six fields of view were imaged for each sample, for a total of 64,512 fields of view. Because there are three channels, there are 193,536 image files. The files are in DIB format, as produced by the Cellomics ArrayScan instrument at the Whitehead–MIT Bioimaging Center. We recommend using Bio-Formats to read the DIB files. Each image is 512 x 512 pixels.
The filenames are of the form
NIRHTa+002/AS_09125_050117080001_A01f00d0.DIB,
where “+” identifies the plate as a puromycin-treated replicate (could be “-”), “002” identifies the plate (could be “001” through “014”), “050117080001” is another identifier for the plate (and therefore the same for all images from the plate), “A01” identifies the well (can be “A01” through “P24”), “f00” identifies the field (can be “f00” through “f05”), and “d0” identifies the channel (can be “d0” for DNA, “d1” for pH3, or “d2” for actin).
We provide the image files as 28 ZIP files, one per plate. Each ZIP file is roughly 2 GB, and contains 6912 DIB files.
BBBC017_v1_images_NIRHTa-001.zip (1.9 GB)
BBBC017_v1_images_NIRHTa-002.zip (2.0 GB)
BBBC017_v1_images_NIRHTa-003.zip (1.8 GB)
BBBC017_v1_images_NIRHTa-004.zip (1.9 GB)
BBBC017_v1_images_NIRHTa-005.zip (1.8 GB)
BBBC017_v1_images_NIRHTa-006.zip (1.9 GB)
BBBC017_v1_images_NIRHTa-007.zip (1.9 GB)
BBBC017_v1_images_NIRHTa-008.zip (1.9 GB)
BBBC017_v1_images_NIRHTa-009.zip (1.9 GB)
BBBC017_v1_images_NIRHTa-010.zip (1.9 GB)
BBBC017_v1_images_NIRHTa-011.zip (1.9 GB)
BBBC017_v1_images_NIRHTa-012.zip (1.9 GB)
BBBC017_v1_images_NIRHTa-013.zip (1.9 GB)
BBBC017_v1_images_NIRHTa-014.zip (2.0 GB)
BBBC017_v1_images_NIRHTa+001.zip (1.8 GB)
BBBC017_v1_images_NIRHTa+002.zip (1.7 GB)
BBBC017_v1_images_NIRHTa+003.zip (1.8 GB)
BBBC017_v1_images_NIRHTa+004.zip (1.9 GB)
BBBC017_v1_images_NIRHTa+005.zip (1.8 GB)
BBBC017_v1_images_NIRHTa+006.zip (1.8 GB)
BBBC017_v1_images_NIRHTa+007.zip (1.8 GB)
BBBC017_v1_images_NIRHTa+008.zip (1.7 GB)
BBBC017_v1_images_NIRHTa+009.zip (1.8 GB)
BBBC017_v1_images_NIRHTa+010.zip (1.8 GB)
BBBC017_v1_images_NIRHTa+011.zip (1.8 GB)
BBBC017_v1_images_NIRHTa+012.zip (1.8 GB)
BBBC017_v1_images_NIRHTa+013.zip (1.8 GB)
BBBC017_v1_images_NIRHTa+014.zip (1.8 GB)
Metadata
The metadata for the experiment (including the shRNAi constructs applied to each well and their targets) are supplied as a Microsoft Excel spreadsheet. The columns “384-Plate#” and “384-well” map to the numbers and well positions in the image filenames, with the exception that plate number 15 in the spreadsheet maps to plate number 14 in the filenames.
The plate identified as 384-Plate# 14 in the spreadsheet was planned to be in th experiment, but was not included for technical reasons. The remaining 5376 rows of data correspond to the 5367 samples in each replicate experiment (the puromycin-treated replicate and the untreated replicate).
Recommended citation
"We used image set BBBC017v1 available from the Broad Bioimage Benchmark Collection [Ljosa et al., Nature Methods, 2012]."
Copyright

The BBBC017 images and ground truth are licensed under a Creative Commons Attribution-NonCommercial-ShareAlike 3.0 Unported License by David Root and Anne Carpenter.